
When you look at a crowd of people, whether they are adults or children, everyone has a different height, weight, and shape. Some people are shorter while others are taller, some are slimmer while others have some extra padding. With so many different body shapes, it can be challenging for doctors to tell whether kids are growing at a normal rate. So they rely on a range of chart of height and weight variations for each age, which gives them a general idea of whether a child is healthy or not.
Child Height and Weight Chart
The following charts provide you a reference for your child as he or she grows. They are arranged by age and gender since those are considered the key factors.
Note: The height is in cms, and weight is in kg.
|
Boys |
Girls |
||||
|
Age |
Weight |
Height |
Age |
Weight |
Height |
|
Birth |
2.6 |
47.1 |
Birth |
2.6 |
46.7 |
|
3mts |
5.3 |
59.1 |
3mts |
5.0 |
58.4 |
|
6mts |
6.7 |
64.7 |
6mts |
6.2 |
63.7 |
|
9mts |
7.4 |
68.2 |
9mts |
6.9 |
67.0 |
|
1yr |
8.4 |
73.9 |
1yr |
7.8 |
72.5 |
|
2yrs |
10.1 |
81.6 |
2yrs |
9.6 |
80.1 |
|
3yrs |
11.8 |
88.9 |
3yrs |
11.2 |
87.7 |
|
4yrs |
13.5 |
96.0 |
4yrs |
12.9 |
94.5 |
|
5yrs |
14.8 |
102.1 |
5yrs |
14.5 |
101.4 |
|
6yrs |
16.3 |
108.5 |
6yrs |
16.0 |
107.4 |
|
7yrs |
18.0 |
113.9 |
7yrs |
17.6 |
112.8 |
|
8yrs |
19.7 |
119.3 |
8yrs |
19.4 |
118.2 |
|
9yrs |
21.5 |
123.7 |
9yrs |
21.3 |
122.9 |
|
10yrs |
23.5 |
124.4 |
10yrs |
23.6 |
123.4 |
|
11yrs |
27.7 |
134.3 |
11yrs |
28.9 |
134.4 |
|
12-13yrs |
30.6-35.0 |
137.7-143.3 |
12-13yrs |
32.8-38.9 |
139.2-147.4 |
|
14-15yrs |
37.6-40.9 |
146.8-153.6 |
14-15yrs |
40.3-42.0 |
151.2-152.4 |
|
16yrs+ |
47.6±0.7 |
161.5±1.1 |
16yrs+ |
47.7±1.0 |
159.2±1.7 |
The Body Mass Index (BMI)
The Body Mass Index (BMI) shows the way that your weight and height compare to each other. It is based on a simple equation where
BMI = weight / height2
BMI is not very accurate for those who are extremely muscular but for the majority of the population, a higher BMI indicates that a person is fatter in comparison to their height.
How to Understand Growth Percentile
Your child’s doctor may start calculating their BMI at age 2. This measurement can provide an estimate of your child’s body fat, although it is not always accurate.
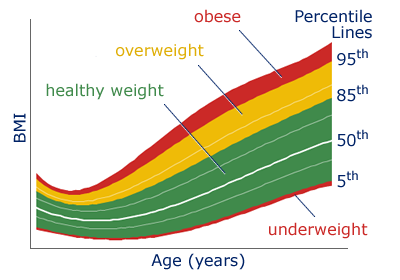
A person’s weight, height, and BMI percentile shows how they compare to other people. If someone is in the 50th percentile for height, this indicates that they are taller in height than 50 of 100 average kids of the same sex and age. Being in the 80th percentile for weight means that a person is heavier than 80 of 100 kids with the same age and sex.
Note that most official child height and weight chart options were created during the 1970s and 1980s. This happened before the childhood obesity epidemic began.
The Growth Chart
To take full advantage of the child height and weight chart, your child’s doctor will take the following measurements at every regularly scheduled checkup:
- Weight will be measured in pounds and ounces or kilograms and grams.
- Height is measured while children over 3 are standing and while those under 3 are lying down.
- Head circumference is measured by wrapping the measuring tape above the eyebrows and around the back of your child’s head.
The health care provider will create a growth chart that contains the relevant measurements at every visit. They then compare the measurements with the “normal” range for other children of their age and gender. They continue tracking all information on the same chart.
What to Remember When Reading the Growth Chart
It is common to worry if you find out that your child’s head size, weight, or height is smaller than the averages for their age range. Parents always worry about everything and this can lead to concerns about whether their child will be able to play sports or do well academically. By learning a few things about how to understand a child height and weight chart, it will be easier to read the chart and understand your child’s results. Here are some important facts all parents and doctors should keep in mind:
- Mistakes can happen when measuring children. This is particularly true for smaller children and babies who may squirm during the measurements.
- A single measurement doesn’t always give you all the information you need. Weight, in particular, can fluctuate day to day. It is possible that a toddler will lose some weight after being sick with diarrhea, only to go back to the average weight range once they are healthy.
- The measurements defined as “normal” span a very wide range. As such, you shouldn’t usually worry if your child’s weight is the 15th percentile, indicating 85 of 100 kids weigh more. This doesn’t necessarily mean he is sick or that he doesn’t eat enough. It just means he is on the smaller side of average.
- A child’s measurements don’t predict their size or shape as an adult.
Seeing abnormal growth on the charts only indicates a possible issue. Your child’s healthcare provider will figure out whether this is a medical problem or you just need to carefully monitor your child’s growth.